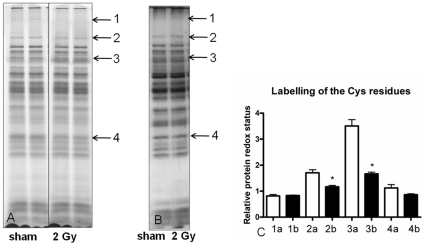
Figure 9. General oxidative status of the sham- vs. 2 Gy- irradiated mitochondrial proteomes.
The level of oxidized proteins was analyzed by saturation DIGE labeling (A). The bands 1–4 were chosen for further analysis as they showed different intensities between sham and exposed samples after the saturation DIGE labeling. The normalization was done by comparing the DIGE band intensities to the total amount of silver stained protein bands (B). In the graphical presentation (C) the columns marked “a” represent bands from the sham-irradiated sample and the columns marked “b” represent bands from irradiated samples. Bands 2 and 3 are significantly downregulated in irradiated samples thus representing oxidized protein groups. Two biological replicates are shown. *p≤0.05, t-test, n = 3.

