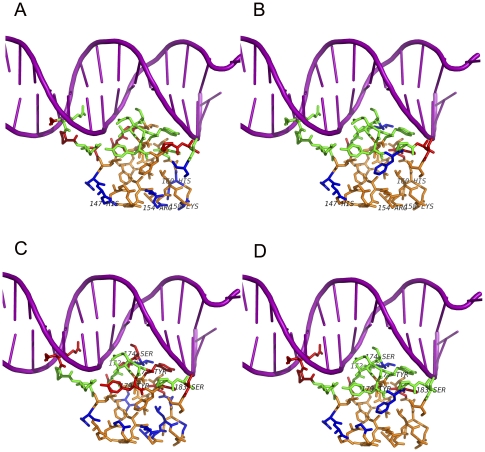
Figure 4. Prediction results shown on 1JKO using four different rank-based methods.
(A) Interface propensity-based method. (B) Weighted average interface propensity-based method. (C) Betweenness centrality-based method. (D) Weighted average betweenness centrality-based method. Colors of different residues are defined as follows: green denotes true positives (TP), blue denotes false positives (FP), orange denotes true negatives (TN), and red denotes false negatives (FN). Purple cartoon denotes the DNA molecules.

