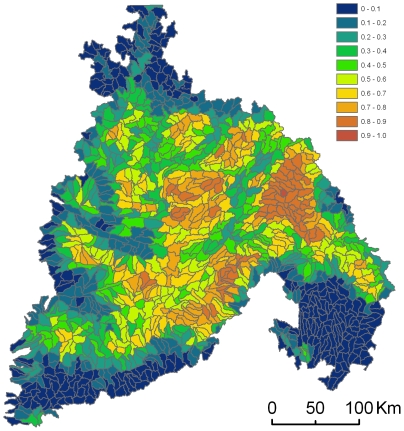
Figure 2. Planning unit cost based on naturalness.
Planning units are ranked by the average degree to which each grid cell within the planning unit has been converted to human-dominated land-cover types (e.g. urban or agricultural areas). Planning units that, on average, have grid cells with less natural land cover remaining are red and have a high cost relative to areas with more natural land-cover types remaining (blue). The actual values are calculated as 1-(the mean of the naturalness values of each grid cell in the planning unit). Naturalness refers to the proportion of natural land-cover types in each grid cell.

