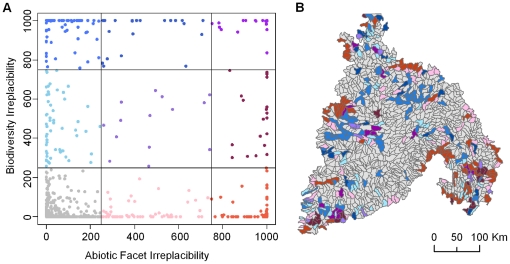
Figure 6. Scatterplot of irreplaceability.
Irreplaceability is measured as the number of times a planning unit was selected across 1000 potential networks. The plot shows the irreplaceability of planning units for representing bioidiversity elements plotted against the irreplaceability of planning units for representing abiotic facets. The solid lines indicate divisions for low irreplaceability (i.e., selected in less than 250 solutions) or high irreplaceability (i.e, selected in more than 750 solutions) (A). The map displays the spatial location and irreplaceability values of planning units in the Columbia Plateau ecoregion corresponding to irreplaceability values for both target types (B). Blue planning units have high irreplaceability for biodiversity elements, red planning units have high irreplaceability for abiotic facets, and intermediate purple planning units have high irreapleacbility for both. Grey planning units are not important in representing either type of conservation element.

