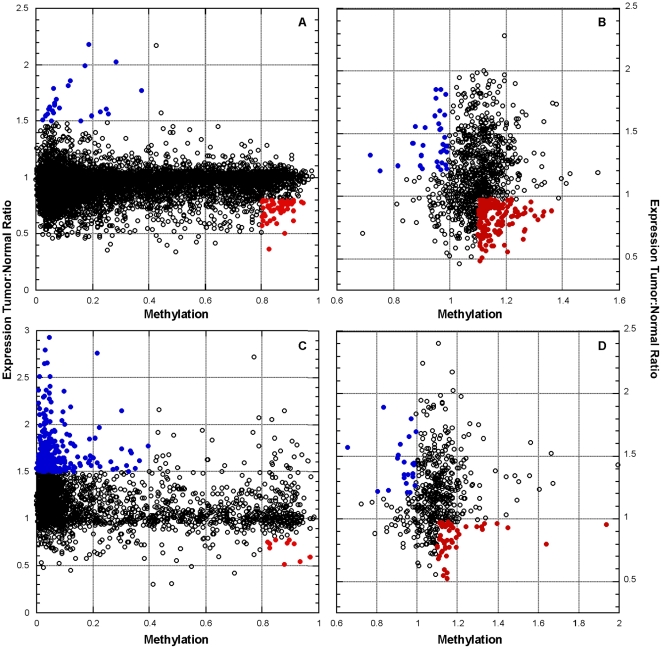
Figure 5. Oncogenic and tumor suppressor features in ovarian cancer.
We isolated genes (all points) with extreme copy number variation from the TCGA (A and C) and MSKCC (B and D) data sets. Methylation and tumor to normal expression ratio was then compared for genes at low CNV (A and B) and high CNV (C and D). Genes with oncogenic features (blue ovals; high expression and low methylation) and tumor suppressor features (red ovals; low expression and high methylation) were identified (Table 3).

