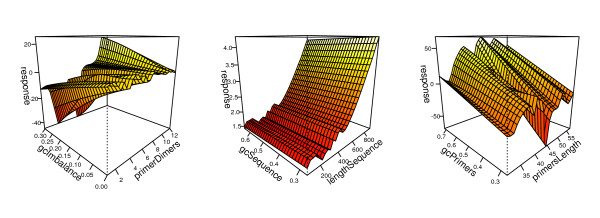
Figure 2.
Perspective plot views of the GAM. Results of the best-fitting smooths for the variables included in the model. The interaction between the two variables is presented as a surface; the z-axis shows the response and the relative importance of each variable is presented in the x- and y- axis.

