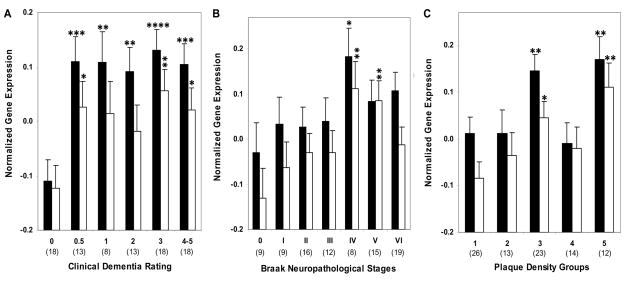
Figure 2.
Normalized LRP (Black bars) and ApoE mRNA (white bars) expression in area 20 plotted against CDR scores, Braak neuropathological stages and NP density groups. ANCOVA was used to compare gene expression in individuals with varying degree of dementia (CDR 0.5–5) and AD associated neuropathology (Braak stage I-VI, NP density 2–5) relative to the control group. Mean values ± SEM are shown. *, p < 0.05; **, p < 0.01; ***, p < 0.001; ****, p < 0.0001. Number within the parentheses indicates the individuals within each group.

