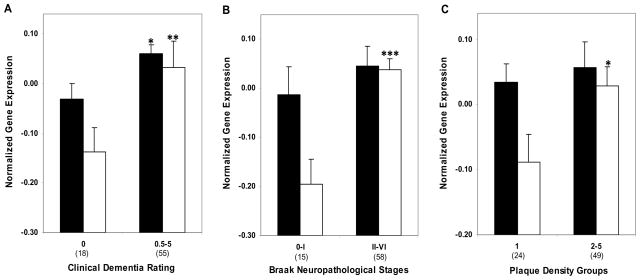
Figure 3.
LRP (Black bars) and ApoE mRNA (white bars) expression in individuals with and without dementia or AD associated neuropathology in the hippocampus. Mean values ± SEM are shown. *, p < 0.05;**, p < 0.01; ***, p < 0.001; ****, p < 0.0001. Number within the parentheses indicates the individuals within each group.

