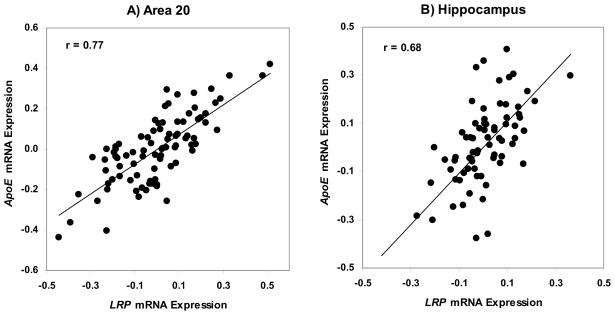
Figure 6.
Association between ApoE and LRP gene expression. A. Partial correlation of LRP and ApoE gene expression controlling for age and RIN in area 20 is (r = 0.768, df = 84, p < 0.0001). B. Partial correlation of LRP and ApoE gene expression controlling for age and pH in hippocampus is (r = 0.681, df = 69, p < 0.0001).

