
Figure 3.
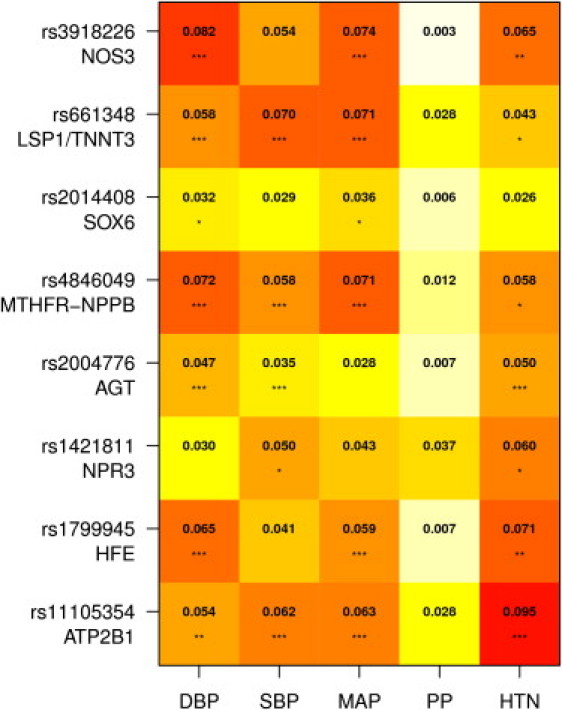
Heat Plot Showing Percentage of Phenotypic Variance Explained in All Available Data for the Eight SNPs
Numeric values are percentage R2 for continuous traits (DBP, SBP, MAP, PP) and Cox and Snell pseudo-R2 for HTN. Each SNP explains less than 0.1% of phenotypic variance. Stars indicate significance levels adjusting for Meff = 58409 tests: ∗p ≤ 0.05/58,409, ∗∗p ≤ 0.01/58,409, ∗∗∗p ≤ 0.001/58,409.