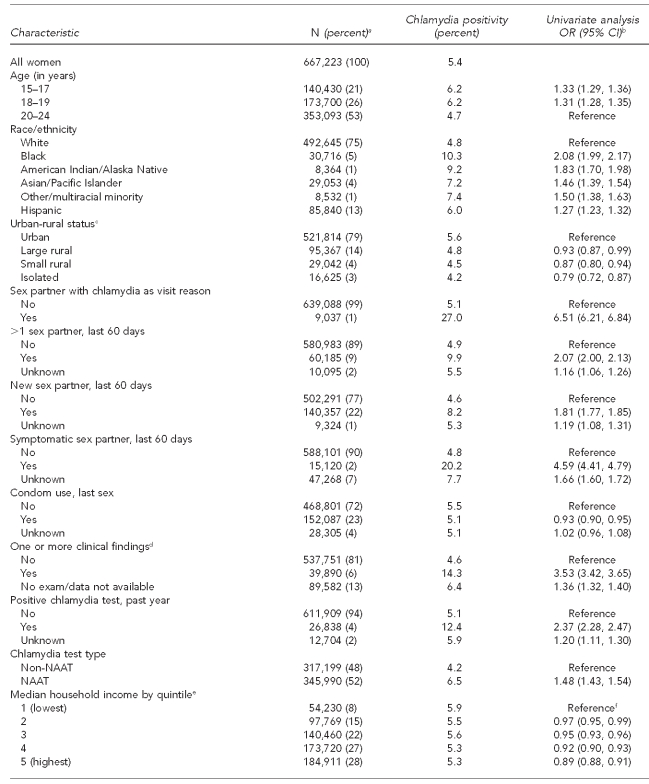
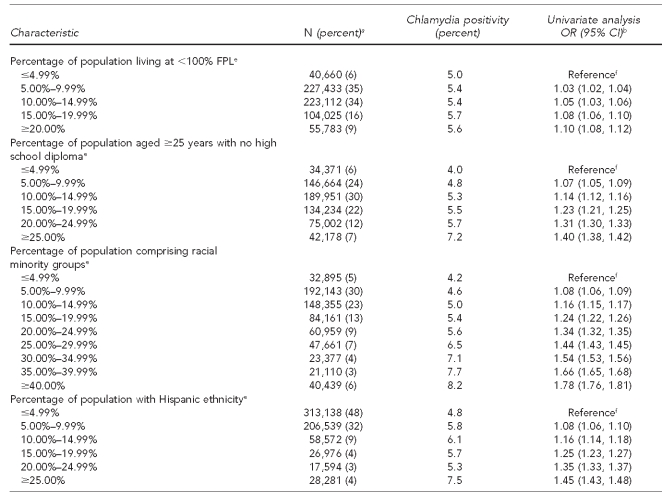
Table 1.
Characteristics of women aged 15–24 years and chlamydia positivity in U.S. Public Health Service Region X family planning clinics, 1997–2006
aTotal N per variable may not sum to 667,223 due to missing information on some test records. Percentages are based on number of responses in each category; percentages may not add to 100 due to rounding.
bCrude ORs and 95% CIs were produced via generalized mixed model with logistic link, incorporating clinic as a random effect (to account for records clustering by clinic) and, for ABSM covariates, ZIP code as a random effect (to account for potential clustering and correlation at the ABSM level).
cABSM based on rural-urban commuting area codes associated with client residential ZIP code. Urban is defined generally as U.S. Census Urbanized Areas (UA), large Urban Clusters (UC), or ZIP codes with high proportions of commuting into UAs or UCs. Large rural is defined as areas with a population of 10,000–49,999 and relatively lower commuting or secondary flow levels to UA and UC. Small rural is defined as areas with a population of 2,500–9,999 and secondary flow commuting statistics. Isolated areas are ZIP codes with primary flow to areas outside of UAs or UCs, as well as having little functional relationship to cities and towns.
dIncludes cervicitis, friable cervix, ectopy, and pelvic inflammatory disease
eABSM based on U.S. Census 2000 ZIP-code tabulation area associated with client residential ZIP code. Note: household median income quintiles calculated from state-specific ZIP-code tabulation area statistics due to variation in quintiles for Alaska, Idaho, Oregon, and Washington.
fBecause ABSMs generally appeared to have a linear relationship between increasing categories and chlamydia, we incorporated them assuming this linear model. This produces a single estimate of the increase in the odds per each incremental category (quintile or 5% increment depending on ABSM). The category-specific estimated ORs were then calculated using this single estimate.
OR = odds ratio
CI = confidence interval
NAAT = nucleic acid amplification technology
FPL = federal poverty level
ABSM = area-based socioeconomic measure


