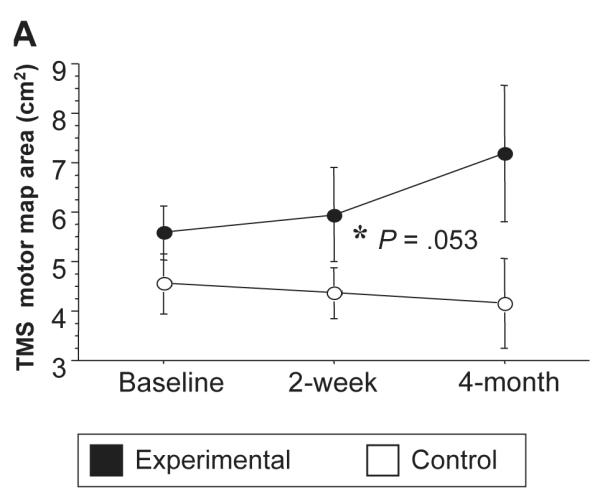
Figure 2.

Longitudinal changes in transcranial magnetic stimulation (TMS) motor map area (3A) on the ipsilesional hemisphere. Note that there was a trend for an increased map area when comparing experimental (black dots) and control groups (P = .053) over a 4-month period.
