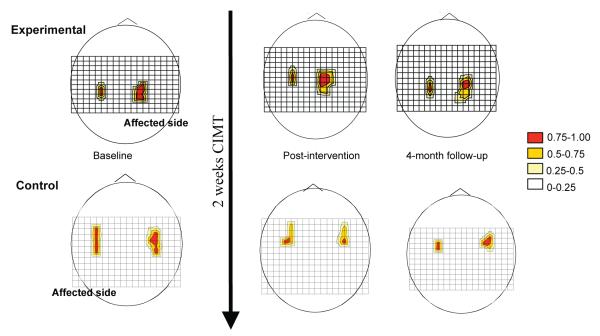
Figure 3.
Longitudinal changes in transcranial magnetic stimulation (TMS) motor map area of 2 representative subjects. The grid size is 1 cm and (0,0) is Cz in the 10-20 EEG system. Motor responses at each scalp position are color-coded by motor evoked potential size (relative to the maximal response). Increased TMS motor map area of ipsilesional hemisphere was observed in a subject assigned to the experimental group over a 4-month period (top diagrams) whereas the map area of the subject assigned to the control group tended to decrease (bottom diagrams).

