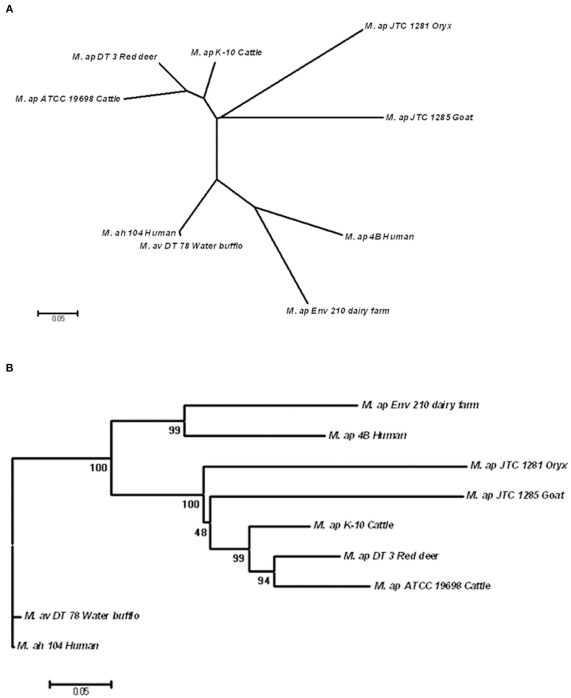
Figure 5.
Phylogenomic analysis of M. ap and M. avium strains. (A) A dendrogram displaying an un-rooted, Neighbor-joining tree of the concatenated SNPs from all eight mycobacterial isolates under study. (B) A rooted Neighbor-joining tree using M. ah 104 genome as out group. The bootstrap consensus tree inferred from 1,000 replicates is taken to represent the evolutionary history of the taxa analyzed. The bootstrap replicates are marked on each branch and a less than 50% bootstrap replicates were collapsed. The percentage of replicate trees in which the associated taxa clustered together in the bootstrap test is shown next to the branches.

