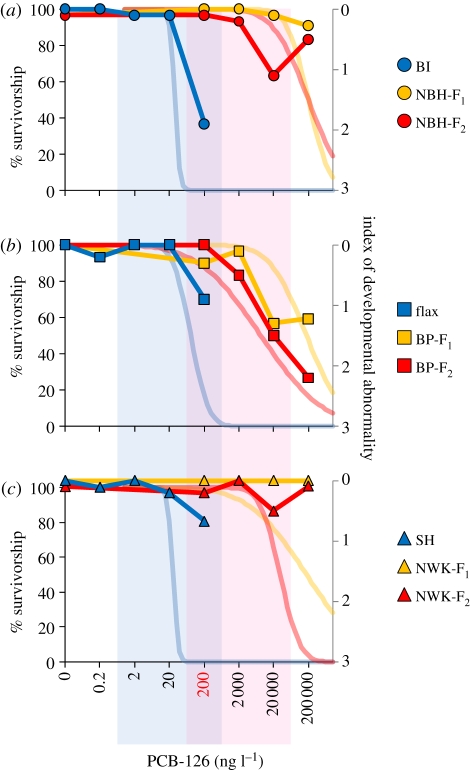
Figure 2.
Survivorship and developmental effects upon exposure to increasing log10 doses of PCB-126 (ng l−1). Light blue, red and yellow curves represent embryonic and larval survivorship out to 7 days post-hatch (primary y-axis) modelled from Nacci et al. [5]. Bold blue, red and yellow points and curves represent average severity of developmental abnormality (secondary y-axis) as a function of PCB-126 dose. Each panel includes data from geographically paired populations (symbols and abbreviations as in figure 1). Colours unite populations with similar pollution exposure histories: blue is for reference populations, whereas yellow and red are for tolerant population F1 and F2 embryos, respectively. Vertical light blue and light pink panels highlight ‘effects-matched’ dose ranges used for comparative transcriptomics profiling for reference and tolerant populations, respectively, where the 200 ng l−1 dose (red) is common to all populations. (a) Dark blue circles, BI; yellow circles, NBH-F1; red circles, NBH-F2. (b) Dark blue squares, flax; yellow squares, BP-F1; red squares, BP-F2. (c) Blue triangles, SH; yellow triangles, NWK-F1; red triangles, NWK-F2.

