Figure 3.
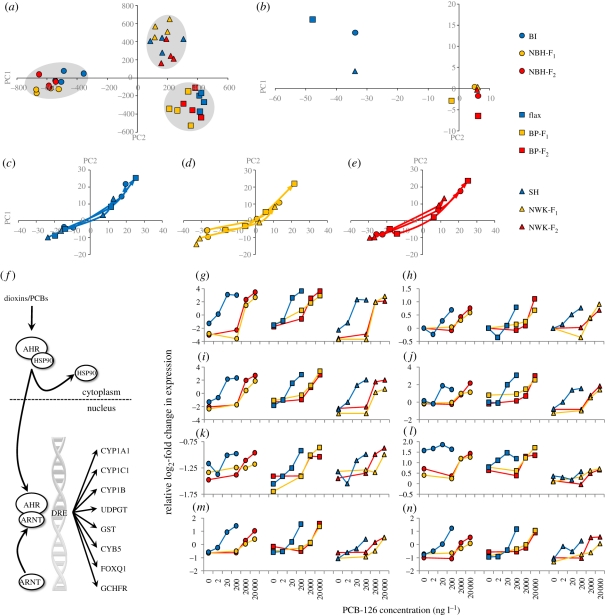
(a–e) Principal components (PC) analyses of gene expression differences. Blue circles, BI; yellow circles, NBH-F1; red circles, NBH-F2; blue squares, Flax; yellow squares, BP-F1; red squares BP-F2; blue triangles, SH; yellow triangles, NWK-F1; red triangles, NWK-F2. (a) Genes that are population-variable in expression only (not dose–responsive) cluster geographical pairs of populations, irrespective of exposure history. (b) Response trajectories for genes that show population-specific dose–response (AHR signalling targets) at the common dose (200 ng l−1 minus control) show that F1 and F2 embryos from tolerant populations converge on the same response. (c–e) Population-specific dose–response genes show identical response trajectories through PC space (PC1 and PC2) at ‘effects-matched’ doses (see text and figure 2), which are offset by two orders of magnitude between (c) reference, (d) tolerant F1 and (e) tolerant F2 embryos, where the base of each line represents the control dose and the line connects through the lowest to middle to highest dose (at arrow head) for each population. (f) Canonical dioxin/PCB-induced aryl-hydrocarbon-mediated signalling pathway and gene battery turned on in our data. (g–n) Each panel shows population-specific dose–response of expression for AHR gene battery members showing divergence between tolerant and sensitive populations but convergence among tolerant populations. (g) CYP1A1; (h) GST; (i) CYP1C1; (j) CYB5; (k) CYP1B; (l) FOXQ1; (m) UDPGT; (n) GCHFR. Tolerant populations show a similar dose–response to PCB-126 as sensitive populations, but at concentrations two orders of magnitude higher. Common symbols (circles, squares or triangles) unite geographically paired populations as in panels (a–e), and blue represents sensitive populations, yellow represents tolerant populations F1 and red tolerant populations F2. Dependent variable is PCB-126 concentration (ng l−1) and independent variable is relative log2 fold change in gene expression level.

