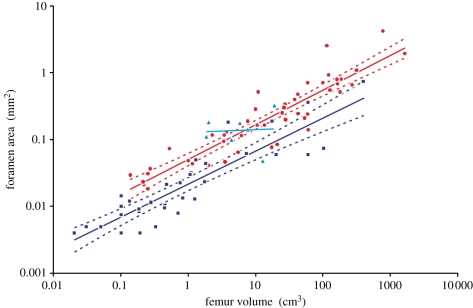
Figure 2.
Relationship between femur volume (VF) and foramen area (A) for mammals (red dots,  ), non-varanid reptiles (dark blue squares,
  ) and varanid reptiles (light blue triangles,
  ), plotted on log–log axes. 95% confidence intervals of the regression mean are displayed. Regressions are compared in table 1.

