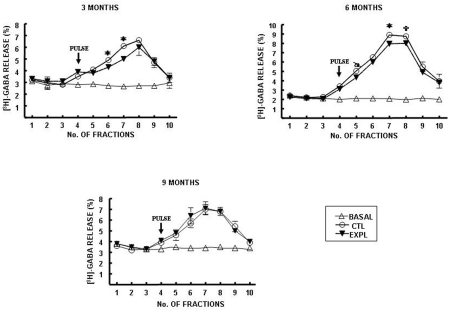
Fig. 2.
[3H]-GABA release from hippocampal slices of mice exposed to
methamidophos. Statistics are presented as the mean ± SEM of six–seven experiments
(n=1 per experiment) with determinations duplicated. Statistically different with
respect to the control group ( and
and  : p<0.001 and p<0.05, respectively).

