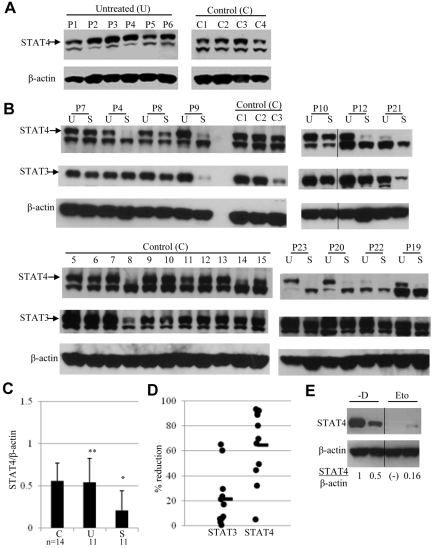
Figure 1.
Expression of STAT4 in cells obtained before and after chemotherapy. (A) STAT4 protein expression was analyzed by immunoblotting of PBMCs from 4 healthy controls (C1-C4) and 6 untreated lymphoma patients (P1-P6). Samples from controls and patients were run in separate gels and exposure was done at the same time. The indicated upper STAT4 band detected with anti-STAT4 mAb was confirmed with anti-STAT4 polyclonal Ab.15 (B) Immunoblot analysis of STAT4 protein levels in control (C1-C3 and C5-C15) and lymphoma patient (P4, P7-P10, P12, P19-P23) PBMCs. Lymphoma patient PBMCs were obtained before (lanes labeled “U” for untreated) and 3 weeks after (lanes labeled “S” for standard dose) their first cycle of standard-dose chemotherapy plus rituximab. The chemotherapy regimen was R-CVP for patients P1, P6, P10, and P20 and R-CHOP for all other patients. A vertical line has been inserted to indicate the repositioned gel lane. (C) The levels of STAT4 protein in panel B were quantified by densitometry of the corresponding bands using the National Institutes of Health ImageJ program, and each sample was normalized to endogenous control β-actin as the ratio. Results are presented as means ± SD from 14 control and 11 patient samples. Blots in panel B were run in different gels but exposed to the same extent. *P < .05 relative to controls (C) or untreated lymphoma patients (U); **P > .05 relative to controls (C). (D) Changes in STAT4 and STAT3 protein levels in PBMCs obtained from each patient after standard-dose chemotherapy (S) are presented as the percentage of reduction compared with PBMCs obtained before chemotherapy treatment (U). The average percentage of reduction was obtained from the same 11 patients as in panel B and shown as the horizontal line in the graph. (E) Analysis of STAT4 protein in mice treated without or with etoposide. Tumor-bearing mice were treated with vehicle or etoposide as described in “Methods.” Spleens were harvested from 2 mice killed on day 29 of study. CD4+ T cells were isolated from each spleen using positive selection with CD4 magnetic beads (Miltenyi Biotec). Total protein extracts from isolated cells were subjected to immunoblotting analysis. The level of STAT4 protein in each mouse was normalized to internal control β-actin and is presented as the ratio indicated below. Nondetectable STAT4 protein is presented as (-). Results shown are representative from 2 independent studies. A vertical line has been inserted to indicate the repositioned gel lane.

