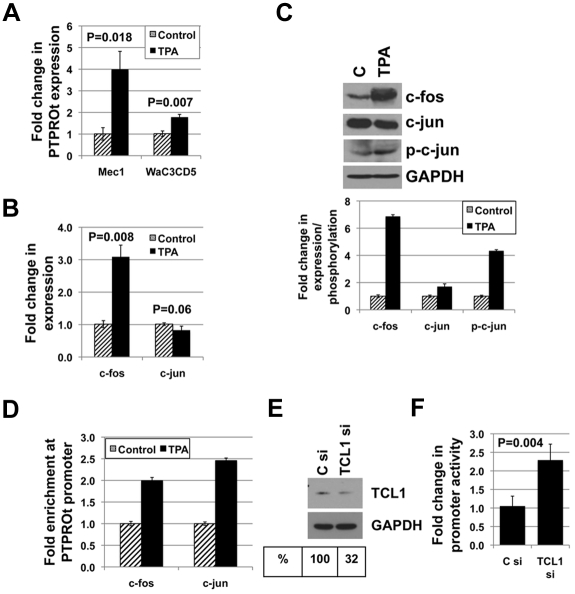
Figure 6.
AP-1 elements and TCL1 are involved in the regulation of PTPROt in CLL-like cell line Mec1. (A) Mec1 and WaC3Cd5 cells treated with 10 ng/mL TPA for 24 hours were used for real-time RT-PCR analysis of PTPROt. (B) Expression of c-fos and c-jun in Mec1 cells treated with TPA was measured by real-time RT-PCR. (C) Western blot analysis was performed to determine expression of c-fos, c-jun, p-c-jun, and GAPDH as well as phosphorylation of c-jun. Quantification of bands is represented as column graph. (D) Chromatin immunoprecipitation was performed on untreated and TPA-treated Mec1 cells using antibodies against c-fos and c-jun followed by PCR for PTPROt promoter. The data are normalized to input and represented as fold enrichment in TPA-treated cells over control cells. Mec1 cells were transfected with PTPt-P-Luc promoter reporter construct along with either control siRNA or siRNA against TCL1. (E) Western blot analysis was performed to confirm knockdown of TCL1. (F) Luciferase activity measured by a dual luciferase assay kit was normalized (firefly/Renilla) and is represented as fold change in TCL1 siRNA-transfected cells over that in control siRNA-transfected cells.

