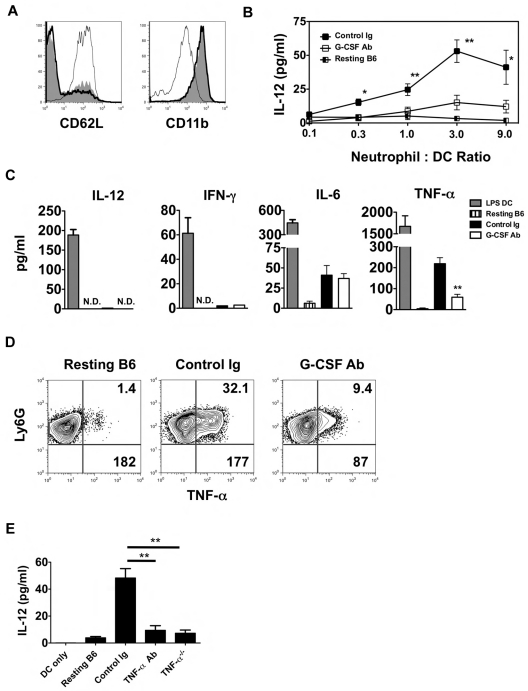
Figure 5.
TNF-α from lung recipient neutrophils drives IL-12 expression in DCs. (A) Representative histogram (n = 4) of CD62L and CD11b expression of either neutrophils isolated from the airway of control Ig–treated (thick line) and G-CSF Ab-treated (solid line) Ext CI Balb/c → B6 lung recipients on POD 1 or neutrophils from resting B6 mouse BM (thin line). (B) Airway neutrophils from control Ig–treated or G-CSF Ab–treated Ext CI Balb/c → B6 lung recipients on POD1 or neutrophils from resting B6 mouse BM were cocultured with BMDCs in the indicated neutrophil to DC ratios for 24 hours and then supernatants were assessed for the accumulation of IL-12. Results are representative of 2 independently performed experiments. (C) BMDCs were stimulated with 10 ng/mL of LPS for 24 hours (LPS DC) or POD 1 airway neutrophils from control Ig–treated or G-CSF Ab–treated Ext CI Balb/c → B6 lung recipients or neutrophils from resting B6 mouse BM were cultured for 24 hours and then supernatants were analyzed for IL-12, IFN-γ, IL-6, and TNF-α. Results are representative of 3 independently performed experiments. (D) Intracellular TNF-α expression from resting B6 mouse BM neutrophils or airway neutrophils from control Ig–treated or G-CSF Ab–treated Ext CI Balb/c → B6 lung recipients on POD 1. Representative results from 4 independent experiments are shown, in which the upper right number indicates the percentage abundance of TNF-α+ cells and the lower right number is the mean fluorescence intensity of TNF-α expression. (E) IL-12 accumulation in the supernatants of BMDC culture or BMDC coculture with resting B6 neutrophils, POD 1 airway neutrophils from Ext CI Balb/c → B6 lung recipients, treated with control Ig or TNF-α Abs, or POD 1 airway neutrophils from Ext CI Balb/c → B6 TNF-α−/− lung recipients. Data are representative of 2 independent experiments. Data for panels B and E represent the means ± SEM. *P < .05; **P < .01.

