Fig. 3.
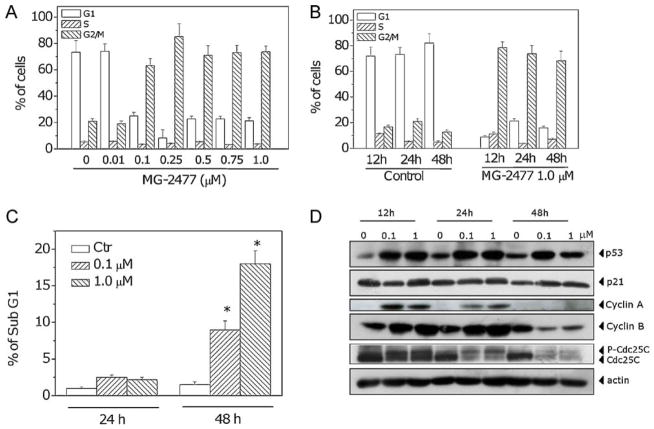
Effects of MG-2477-induced G2/M phase arrest in A549 cells. (A) Cells were treated with different concentrations of MG-2477 for 24 h, and cell cycle distribution was analyzed by flow cytometry after staining the cells with PI. (B) Cells were treated with 1 μM MG-2477 for the indicated times, and cell cycle distribution was analyzed as above. Data are expressed as mean ± SEM of three independent experiments. (C) Percentage of cells in the subG1 peak. Cells were treated with MG-2477 at 0.1 and 1.0 μM for 24 and 48 h. Data are expressed as mean ± SEM of three independent experiments. *p < 0.01 vs. control. (D) Cells were treated with the indicated concentration of MG-2477 for the indicated times. Whole cell lysates were subjected to Western blot analysis.

