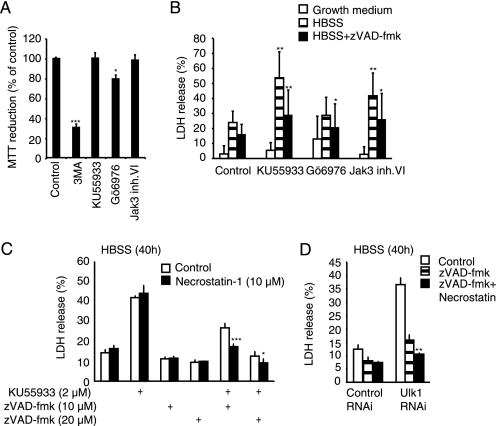
FIGURE 4.
Induction of apoptosis and necroptosis via small-molecule inhibition of autophagy. A, MCF7 cells left untreated (Control) or treated with 10 mm 3-MA, 2 μm KU55933, 8 μm Gö6976, or 5 μm Jak3 inhibitor VI for 40 h were analyzed for cell viability by the MTT reduction assay. Values represent average ± S.D. of three independent experiments. B, MCF7 cells in either normal growth medium, HBSS or HBSS+ zVAD-fmk (20 μm) were treated with the indicated inhibitors for 40 h as in A, and cell death was analyzed by the LDH release assay. Values represent average ± S.D. of at least three independent experiments. C, cells were starved in HBSS for 40 h in the presence of KU55933, zVAD-fmk, and/or Necrostatin-1 as indicated and cell death was measured by the LDH release assay. The values represent average ± S.D. of a representative experiment performed in quadruplicate. D. Cells pretreated with control siRNA or Ulk1 siRNA for 48 h, were starved in HBSS for 40 h in presence of zVAD-fmk and/or Necrostatin-1 as indicated and cell death was analyzed by the LDH-release assay. The values represent average ± S.D. of a representative experiment performed in triplicate. *, p value <0.05; **, p value <0.01; and ***, p value <0.001 as compared with Control (A), Treatment with HBSS (B, striped columns), Treatment with HBSS + kinase inhibitor (B, white columns), corresponding control (C), or treatment with Ulk1-siRNA + zVAD-fmk (D).

