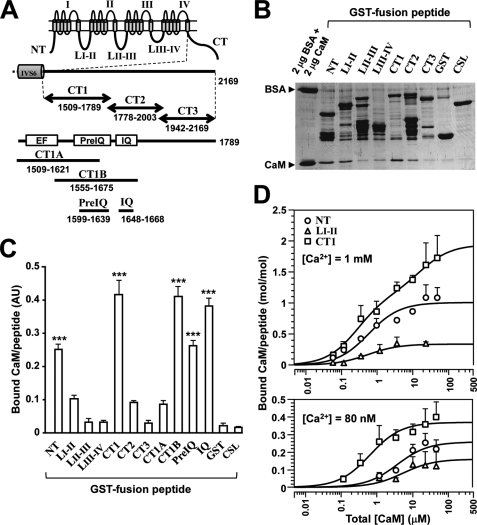
FIGURE 3.
CaM binding to Cav1.2 channel peptides. A, schematic drawing of fragment peptides of Cav1.2 (α1C). Eleven peptides derived from the intracellular regions of the channel were constructed as GST fusion peptides, including NT, LI-II, LII-III, and LIII-IV. The C-terminal domain was divided into three parts as illustrated. CT1 contains regulatory regions (shown as boxes), a Ca2+-binding EF-hand-like motif (EF), and two CaM-binding domains (PreIQ and IQ). Fragments of CT1 (i.e. CT1A, CT1B, PreIQ, and IQ) were also prepared. B, GST pull-down assay for CaM-binding at 1 mm Ca2+. GST fusion peptides (∼1 μm) were mixed with 1 μm CaM, and bound CaM was separated by SDS-PAGE and stained with Coomassie Brilliant Blue. 2 μg of BSA (66 kDa) and 2 μg of CaM (18 kDa) were run as standards. C, summary of pull-down assay for CaM binding. Optical densities of bound CaM were calibrated and displayed in arbitrary units with mean ± S.E. (n = 3–8). Significant differences are marked by *** (p < 0.001; Dunnett's test). D, concentration-dependent binding of CaM to NT (circles), LI-II (triangles), and CT1 (squares) at 1 mm Ca2+ (upper graph) and at 80 nm Ca2+ (lower graph). Data in molar ratio (CaM/GST fusion peptide) were plotted against total [CaM] with mean ± S.E. (n = 4–10). Data were fitted to theoretical curves using Kell software with parameters shown in Table 2.

