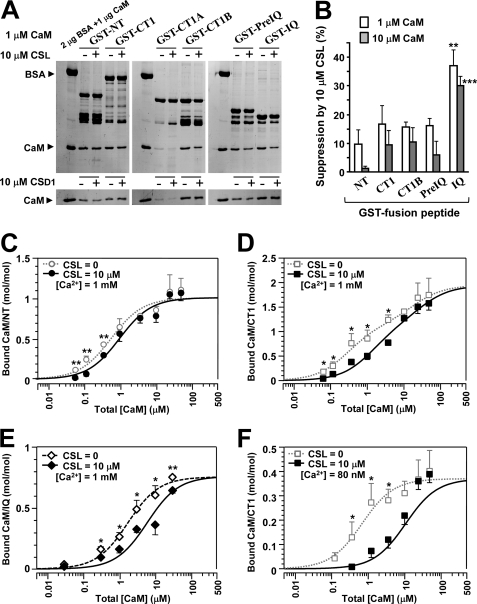
FIGURE 4.
CSL competes with CaM for its site. A, GST pull-down assay for CaM binding to the peptides (NT, CT1, CT1A, CT1B, PreIQ, and IQ) at 1 μm CaM and 1 mm Ca2+. CaM binding was examined in the presence of 10 μm CSL (top) or 10 μm CSD1 (bottom). BSA (2 μg) and CaM (1 μg) were run as standards. B, summary of suppression of CaM binding by 10 μm CSL at 1 μm (open columns) and 10 μm CaM (filled columns). Data are displayed as mean ± S.E. (n = 5–9). Significant differences versus GST-NT (Dunnett's test) are marked by asterisks (**, p < 0.01; ***, p < 0.001). C–F, dose-dependent bindings of CaM to NT (C), CT1 (D), and IQ (E) at 1 mm Ca2+ and to CT1 at 80 nm Ca2+ (F) in the presence of 10 μm CSL. Data in molar ratio (CaM/GST peptide) were plotted against total [CaM] with mean ± S.E. (n = 4–10). Data were fitted to theoretical curves using Kell software with parameters shown in Table 2. For comparison, CaM binding curves in the absence of CSL were taken from Fig. 3D or measured (open symbols), and their fitted curves were superimposed by broken lines. Significant differences from the value without CSL at each point (Dunnett's test) are marked by asterisks (*, p < 0.05; **, p < 0.01).

