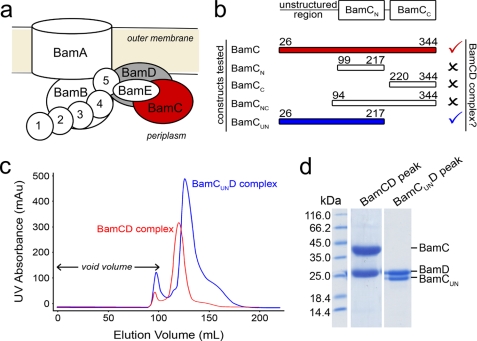
FIGURE 1.
Formation of the BamCD complex. a, schematic diagram of the E. coli BAM complex. Two of the lipoprotein components (BamC and BamD) that are the focus of this study are colored in red and gray, respectively. b, summary of BamC truncations made and their ability to interact with BamD to form the BamCD complex. Check marks signify formation of the complex, whereas X marks signify inability to form the complex. The N- and C-terminal boundaries of each BamC construct are given. c, overlaid size exclusion chromatograms of co-purified BamCD and BamCUND complexes. mAU, milli-absorbance units. d, SDS-PAGE confirmed co-elution of BamC (or BamCUN) with BamD from the major chromatogram peaks shown in c.

