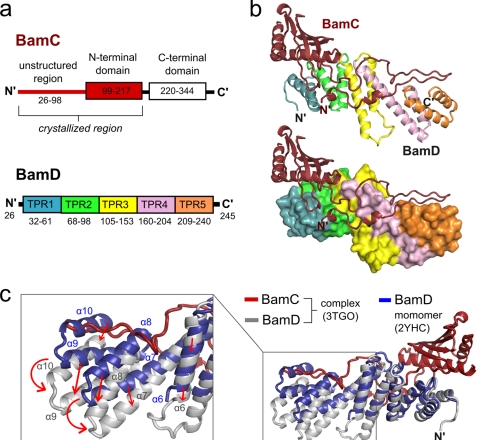
FIGURE 2.
Structure of the BamCD complex and conformational changes in BamD upon binding. a, domain organization of BamC and BamD. Each TPR motif of BamD is shown in a different color. b, structure of the BamCD complex. Ribbon (upper) and surface (lower) diagrams of BamD are shown with the TPR motifs colored as in a. c, BamCD complex (BamC in red and BamD in gray) superimposed onto monomeric BamD (blue). The boxed inset shows a close-up view of the BamD region that undergoes the greatest conformation change upon binding to BamC, with arrows indicating direction of movement.

