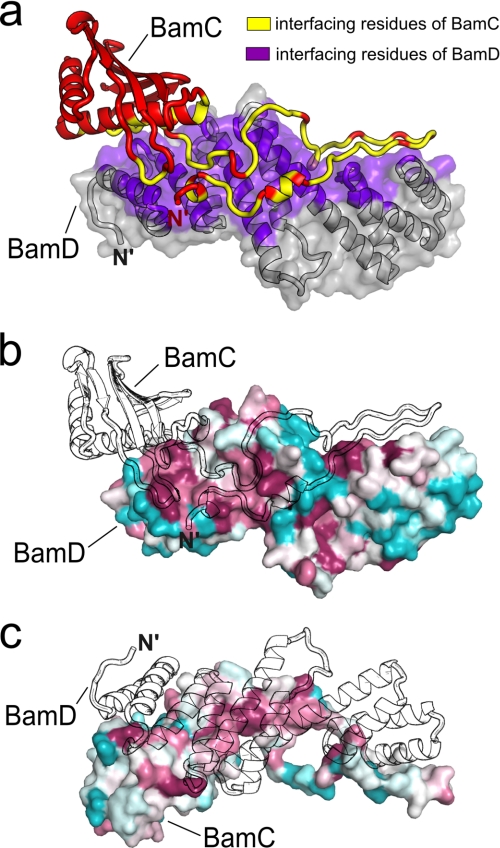
FIGURE 3.
BamC-BamD interface. a, ribbon diagram of BamC (red) with ribbon and semitransparent surface diagrams of BamD (gray). The interfacing residues are colored yellow (BamC) and purple (BamD). b, conserved residues mapped onto BamD with absolutely conserved residues in maroon and highly variable residues in cyan. An outline of BamC is drawn to show its position relative to BamD. c, conserved residues mapped onto BamC and colored as in b. An outline of BamD is also shown.

