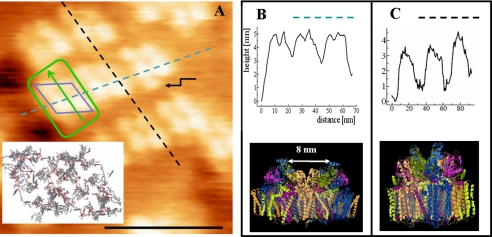
FIGURE 6.
Comparison of topography of grana membranes and PSII crystal structure. A–C, analyses of height profiles of part of the image shown in Fig. 5D (A here). The height profile of the dashed blue line is shown in B, and that of the dashed black line is shown in C. The blue diamond represents the unit of topographic masses in this area, consistent with the diamond-like arrangement of cofactors of PSII core dimers, which is shown in the inset of A. The green outline depicts the repeating length scale within this area following the cross-sections in B and C and the corresponding side views of the PSII core dimer. The Protein Data Bank code for the x-ray crystallographic structures is 2AXT. Scale bar = 50 nm.

