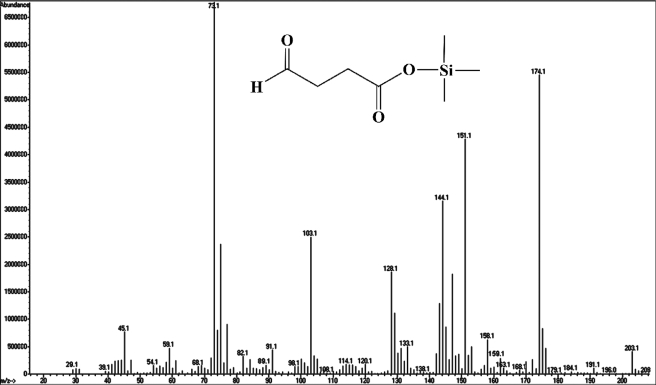
FIGURE 5.
Mass spectrum of succinic semialdehyde as determined by GC-MS analysis. The GC-MS determination with derivatization of silanization by special peak is as follows. A molecular ion peak is seen at m/z 174, and its fragments are at m/z 29 ([CHO]+), 45 ([COOH]+), 89 ([Si(CH3)3O]+), and 73 ([(CH2)2COOH]+).

