FIGURE 2.
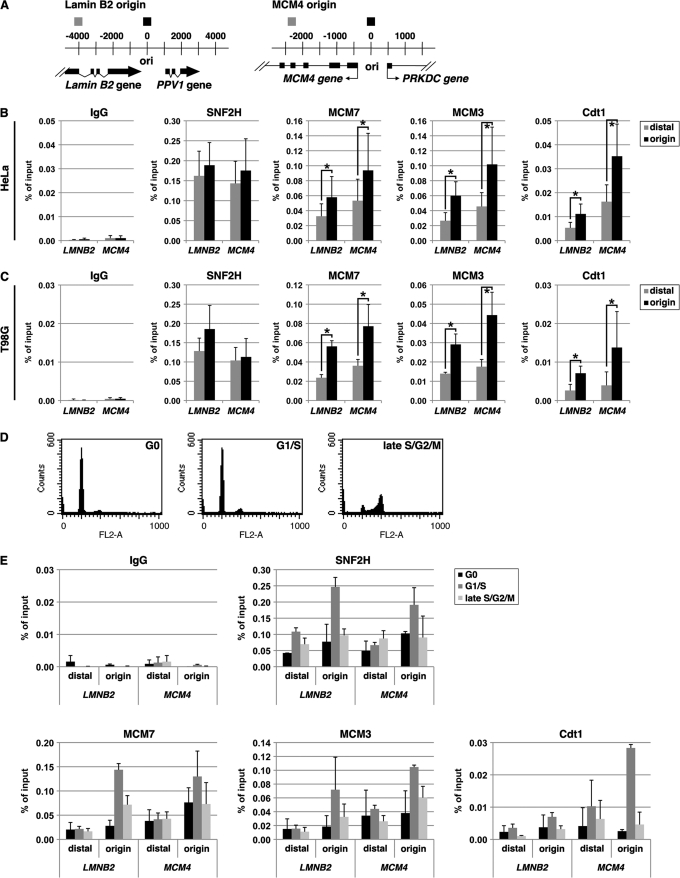
SNF2H interacts with cellular replication origins during the G1 phase. ChIP assay was performed as described under “Experimental Procedures.” Quantitative real-time PCR was performed with DNA templates extracted from chromatin precipitated with control IgGs or antibody against SNF2H, MCM7, MCM3, or Cdt1. A, schematic diagram of the human MCM4 and lamin B2 origin loci. Positions of primer pairs to detect the origins and distal sequences are shown above (black and gray boxes, respectively). Coordinates flanking the origin are given in base pairs. B, results with asynchronously growing HeLa cells are shown as the percent of input DNA. The means ± S.D. are shown (n = 8). C, results with asynchronously growing T98G cells. The means ± S.D. are shown (n = 6). *, p < 0.05. D and E, T98G cells synchronized at the G0 (serum starvation for 48 h), G1/S (10 h after serum addition), and late S/G2/M (24 h in the presence of 50 ng/ml nocodazole after serum addition) phases were examined by FACS analysis (D) or ChIP assay (E). For ChIP data, the means ± S.D. are shown (n = 3).

