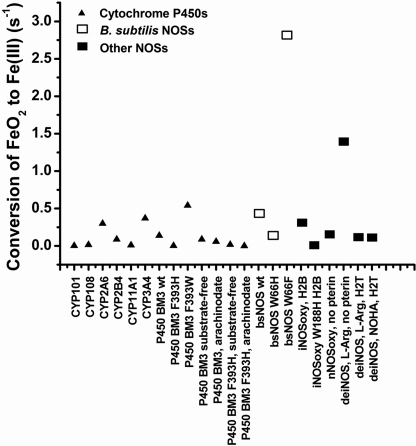
FIGURE 6.
FeO2 autoxidation rates for various hemeproteins. FeO2 autoxidation rates are shown for mammalian and bacterial NOSs and some members of the cytochrome P450 family. In the case of NOSs, the observed rate constants were determined in the presence of oxidized pterin or folate or in their absence. The values and the corresponding references are listed under supplemental Table S4.

