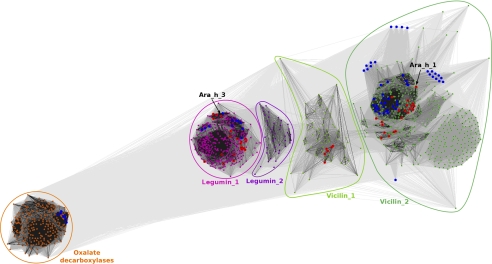
FIGURE 1.
Two-dimensional projection of the CLANS clustering results. Proteins are indicated by dots. Lines indicate sequence similarity detectable with BLAST and are colored by a spectrum of gray shades according to the BLAST p value (black: p value < 10−225, light gray: p value < 10−5). Sequences corresponding to structures in the PDB are indicated by blue dots, sequences of known allergens are indicated by red dots. Peanut allergens Ara h 1 and Ara h 3 are marked with arrows. Because the sequences were downloaded as they are in the nr database, sequences of separate, nonidentical chains in PDB deposits are represented separately. For example, Jack Bean canavalin structures were obtained by crystallization of the proteolytic product of the protein, and both domains are represented by separate sequences, which is why they moved away from the central cluster containing the full-length protein.

