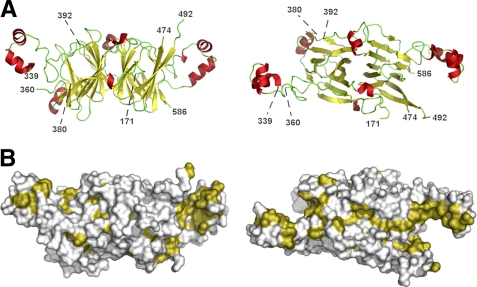
FIGURE 2.
Structure of rsAra h 1. A, ribbon diagram of the Ara h 1 core fragment presented in two different orientations. Numbers indicate the ends of fragments that could be traced. α-Helices are shown in red, β-strands in yellow, and loop regions are shown in green. B, molecular surface of Ara h 1 with hydrophobic residues are shown in olive. Orientation of the molecules is the same as for the ribbon diagrams. Figures from the right side of the panel show molecules as seen from the center of trimer.

