FIGURE 5.
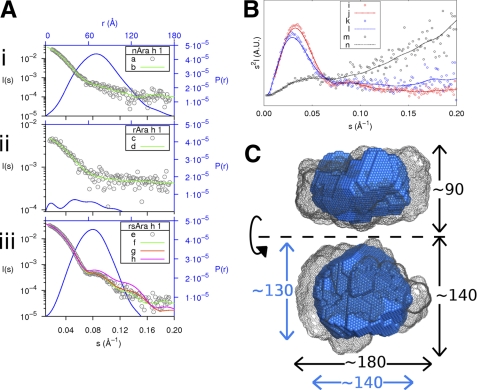
Summary of SAXS data. A, experimental scattering data of each version of Ara h 1 (in gray, black axes) along with the fits of the most probable bead models (in green) and the particle distance distribution functions (in blue, blue axes). Aiii, in addition, shows the theoretical scattering curves of the four trimer (g) and the three trimer (h) SASREF models. B, Kratky plot with experimental points for each version. Where i, k, and m represent rsAra h 1, nAra h 1, and rAra h 1, respectively, along with the corresponding trend lines (j,l,n) determined with the smooth bezier function in GNUplot. C, representation of the most probable bead models of rsAra h 1 (in blue) and nAra h 1 (in gray mesh). The dimensions in Angstroms of each are given in blue and black, respectively. The bottom figure was obtained by rotating the top figure 90 degrees around the specified axis.

