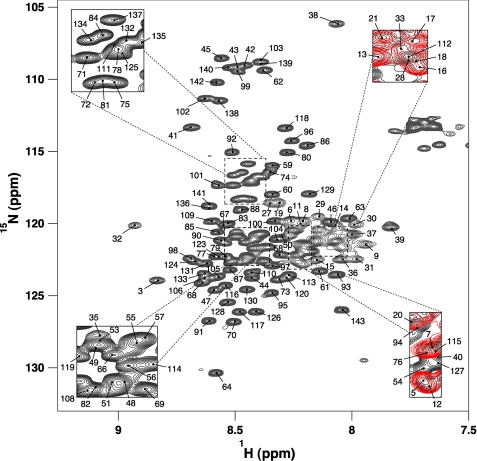
FIGURE 2.
Resonance assignments of IC:1–143. Two-dimensional 1H-15N HSQC spectrum of 0.6 mm 15N IC:1–143 in 10 mm sodium phosphate buffer (pH 6.5), 50 mm NaCl, 1 mm NaN3 recorded at 5 °C. Peaks are labeled according to their backbone resonance assignments. Several peaks corresponding to the N-terminal 40 residues are indicated; the rest are demonstrated through an overlay of the IC:1–40 HSQC (red) on that of IC:1–143 (black).

