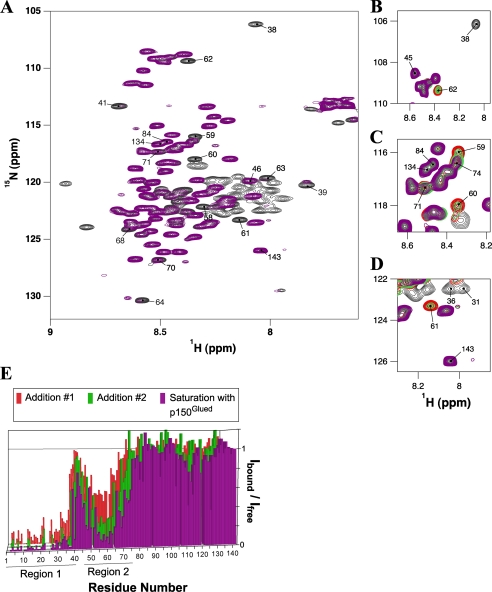
FIGURE 5.
Titration of 15N-labeled IC:1–143 with p150221–509Glued. A, overlay of 1H-15N HSQC spectra of IC:1–143 (black) and p150221–509Glued bound IC:1–143 (purple). Several peaks are labeled whose relative peak volumes are attenuated by more than 70% in the bound state; peaks corresponding to residues 84, 134, and 143 (undiminished relative peak volumes) are also indicated for comparison. The spectra were recorded at pH 6.5 and 5 °C with ∼0.6 mm 15N IC:1–143 in 10 mm sodium phosphate buffer and greater than 2-fold excess of p150221–509Glued in the case of the fully bound state (purple). Portions of HSQC spectra (B–D) show selected sets of peaks during the titration process. Peaks in these overlaid spectra are colored corresponding to 15N IC:1–143 with 0 eq of p150221–509Glued (black), two subsequent additions of p150221–509Glued (red and green, in that order), and greater than 2 eq (purple) of p150221–509Glued. E, numerical plot of relative integrated peak intensity (Ibound/Ifree) versus residue number. Relative peak intensity is defined as the ratio of the integrated peak volume in the spectrum of the complex to the integrated peak volume in the spectrum of the free IC:1–143 protein. Two distinct series of peaks (labeled region 1and region 2) in IC:1–143 exhibited significant attenuation upon interaction with p150221–509Glued.

