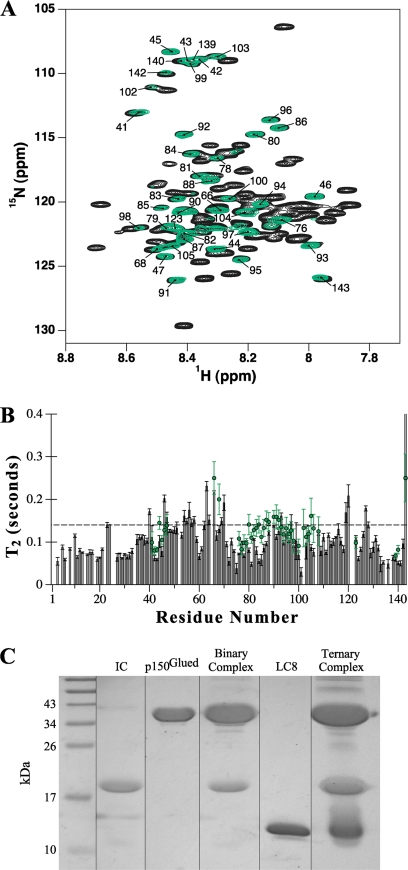
FIGURE 7.
Dynamics of 15N-labeled IC:1–143 in a quaternary complex with p150Glued and light chains. A, overlay of 1H-15N HSQC spectra of apo-IC:1–143 (black) and IC:1–143LL in complex with excess p150221–509Glued and LC8 (green); spectra were recorded at pH 6.5 and 20 °C in 10 mm sodium phosphate buffer. Labeled peaks correspond to those whose relative peak volumes remain at 60% or greater intensity for IC:1–143LL in the quaternary complex. B, T2 relaxation times collected at 20 °C for apo-IC:1–143 (bars) and the remaining visible peaks of IC:1–143LL in complex with excess p150Glued and LC8 (green circles). A dashed line is drawn through the plot to facilitate visual comparison. C, strips from SDS-polyacrylamide gel analysis of components and of the assembled IC quaternary complex used for NMR experiments; IC:1–143LL (lane 2), p150221–509Glued (lane 3), a binary complex of IC:1–143LL saturated with p150221–509Glued (lane 4), LC8 (lane 5), and a quaternary complex of IC:1–143LL combined with saturating amounts of both p150221–509Glued and LC8 (lane 6).

