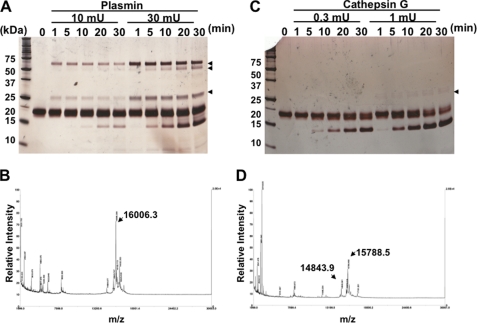
FIGURE 2.
Cleavage of chem163S by plasmin and cathepsin G. A, 10 μm chem163S (total 1 nmol) was digested with 10 and 30 milliunits (180 or 546 nm) of plasmin for the indicated time at 37 °C and analyzed by silver-stained SDS-PAGE. Arrows show the plasmin bands. B, mass spectrometric analysis of chem163S cleaved with 10 milliunits of plasmin for 10 min is shown. C, 10 μm chem163S (total 1 nmol) was digested with 0.3 and 1 milliunits (64 or 213 nm) of cathepsin G for the indicated times at 37 °C and analyzed by silver stained SDS-PAGE. Arrows show the cathepsin G bands. D, mass spectrometric analysis of the products resulting from cleavage of chem163S with 0.3 milliunit (64 nm) of cathepsin G for 30 min was performed.

