FIGURE 2.
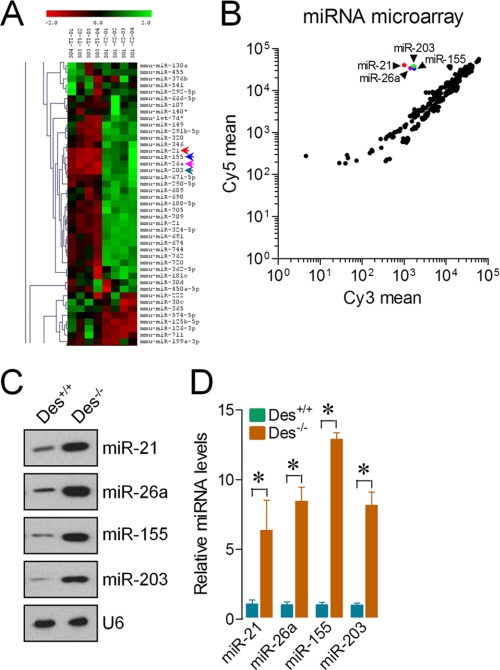
ASMCs of Des−/− mice show altered micro-RNA expression profiles. Total RNA was isolated from the ASMCs of Des+/+ and Des−/− mice to determine expression patterns of miRNA clusters. A, heat map diagram of the two-way hierarchical clustering showing relative miRNA expression levels between the ASMCs of Des+/+ and Des−/− mice. B, data presented on a scatter plot show log10-transformed signal intensities for each probe on both channels for the Cy3-labeled (Des+/+) and Cy5-labeled (Des−/−) samples. Each dot represents one miRNA probe. C and D, RNA used in A was analyzed by a solution hybridization technique with 5′-biotin-labeled miR-21, miR-26a, miR-155, miR-203, and small nuclear RNA U6 (C) and in a separate experiment by qPCR to assay expression of miR-21, miR-26a, miR-155, miR-203, and U6 under the same conditions (D). U6 served as both loading control and normalizer. Gel pictures are representative of three separate experiments. Each bar indicates mean ± S.E. (error bars) (n = 3). *, p < 0.05.

