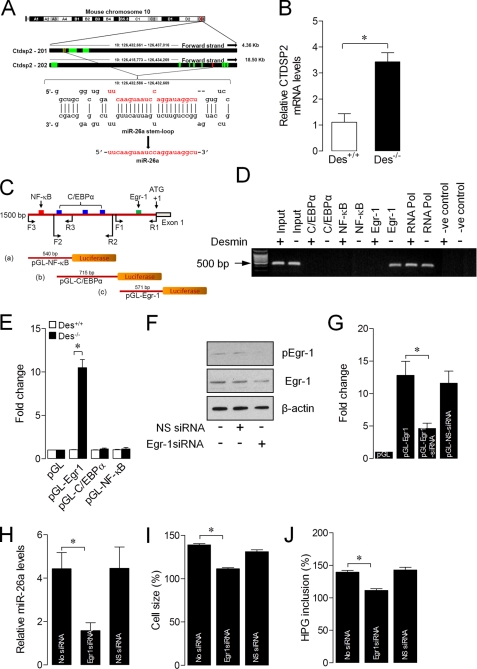
FIGURE 6.
Egr1 regulates miR-26a expression. A, schematic representation of the genomic structure of the mouse Ctdsp2 coding RNA genes in chromosome 10. The red band indicates the position of the Ctdsp2 gene on chromosome 10 or the position of miR-26a on the Ctdsp2 gene. B, total RNA was isolated from the ASMCs of Des−/− mice. Ctdsp2 mRNA levels were analyzed by qPCR. C, schematic representation of the 5′-UTR of the mouse Ctdsp2 gene (miR-26a promoter). The region between −1500 and +1 bp contains putative binding elements for Egr-1 (red), C/EBPα (blue), and NF-κB (green). A 500-bp (pGL-NF-κB), 750-bp (pGL-C/EBPα), or 500-bp (pGL-Egr-1) promoter region was synthesized and linked to the luciferase (Luc) reporter gene. D, chromatin was isolated from the ASMCs of Des+/+ and Des−/− mice and precipitated with anti-c-Egr-1, anti-C/EBPα, anti-NF-κB, anti-RNA Poly II, or nonspecific IgG. qPCRs were performed with three sets of primers, specific for the miR-26a promoter, to identify the specific transcription factor and its region of binding to the miR-26a promoter and resolved in 1% agarose gel. E, a 500-bp (pGL-Egr-1), 700-bp (pGL-C/EBPα), or 500-bp (pGL-NF-κB) promoter region was synthesized and linked to the luciferase reporter gene. ASMCs of Des−/− mice were transfected with empty vector, pGL-Egr-1, pGL-C/EBPα, or pGL-NF-κB miR-26a promoter region. Forty-eight hours after transfection, firefly luciferase activities were estimated and normalized to Renilla luciferase activities. F, ASMCs of Des+/+ mice were transfected with Egr-1 siRNA or nonspecific siRNA (NS-siRNA). After 48 h, total protein was isolated, and Egr-1 protein expression was determined by Western blot. G, ASMCs of Des+/+ and Des−/− mice were transfected with Egr-1 siRNA or its scramble form (SC-Egr-1siRNA). Forty-eight hours after RNAi transfection, cells were transfected with pGL or pGL-Egr-1 vector. After 48 h, firefly luciferase activities were estimated and normalized to Renilla luciferase activities. H–J, Des−/− ASMCs were transfected as shown in F. After 48 h of transfection, miR-26a levels (H), cell size (I), and protein synthesis (J) were estimated. Gel pictures are representative of three separate experiments. Each bar indicates mean ± S.E. (n = 3). *, p < 0.05.

