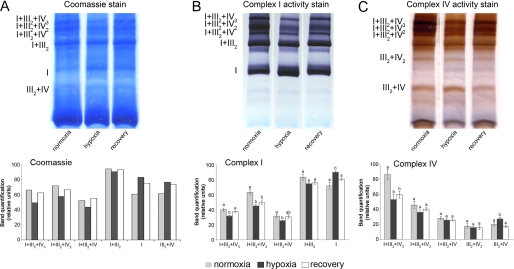
FIGURE 2.
Effect of hypoxia on respiratory supercomplexes. A, shown is blue native PAGE of supercomplexes from mitochondria that were isolated from potato tubers after 36 h of flooding-induced hypoxia ([O2] ≤ 10 μm) or from tubers that regenerated during 36 h in normal air from the hypoxic treatment. As the control, samples were prepared from tubers that were kept in normal air during the entire course of the experiment. The first three lanes (A) show Coomassie-stained proteins from mitochondria isolated from tubers after a normoxic, hypoxic (flooded), or recovery treatment, respectively. The second (B) and third sets (C) of three lanes show activity staining of complex I and complex IV, respectively. B, shown is quantification of color intensity of the bands stained for complex I activity. C, shown is quantification of color intensity of the bands stained for complex IV activity. Bars represent mean values ± S.E. of at least three technical replicates. Significant differences were determined using single-way analysis of variance (p ≤ 0.05), and mean values that are significantly different from each other were marked with different letters above the bars. The results from additional biological repetitions are provided in supplemental Figs. S5 and S6.

