FIGURE 8.
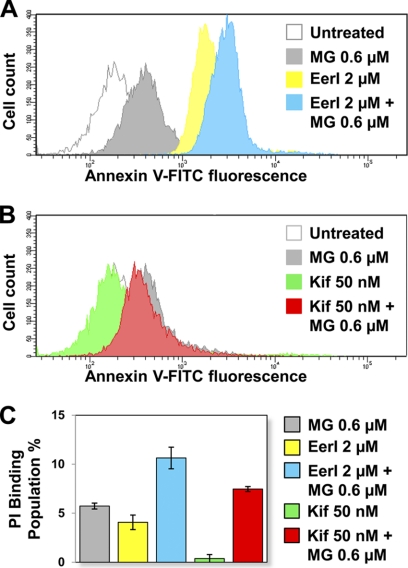
Apoptosis induction in L444P GC patient-derived fibroblasts treated with ERAD inhibitors. Flow cytometry histograms of annexin V-FITC fluorescence intensities (x axis, log scale) plotted against cell counts (y axis, linear scale) obtained from the analysis of untreated cells and cells treated with MG-132 (0.6 μm), EerI (2 μm), and EerI (2 μm) and MG-132 (0.6 μm) (A) or untreated cells and cells treated with MG-132 (0.6 μm), Kif (50 nm), and Kif (50 nm) and MG-132 (0.6 μm) (B) for 16 h. Three independent experiments were conducted, and results of one representative experiment are reported. C, propidium iodide (PI) binding population change (%) of cells treated with EerI (2 and 6 μm), Kif (50 nm), and MG-132 (0.6 μm) for 16 h compared with untreated cells (p < 0.01). The number of total counted cells was 10,000. The data are reported as mean ± S.D. (error bars).

