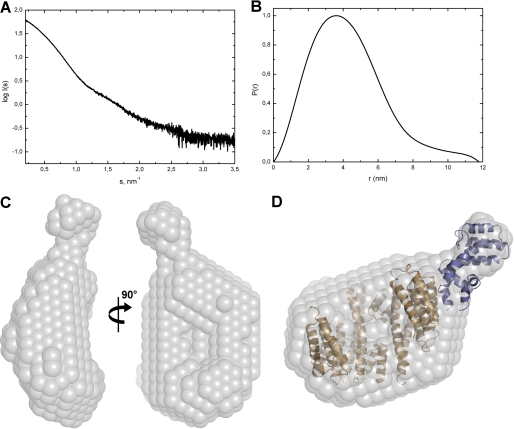
FIGURE 2.
SAXS scattering data and the low-resolution structure of the 14-3-3ζ·pRGS3 complex. A, solution scattering pattern for the 14-3-3ζ·pRGS3 complex. X-ray scattering was measured at three different protein concentrations (2, 4, and 8 mg·ml−1), and no concentration dependence was observed. Scattering intensity I(s) is plotted in relation to the scattering vector s (s = 4πsin(θ)/λ, where 2θ is the scattering angle and λ is the wavelength). B, plot of the distance distribution functions P(r) with the maximum particle distance (Dmax) of 11.8 nm. C, average low-resolution ab initio shape envelope (spheres around the dummy residues) of the 14-3-3ζ·pRGS3 complex as determined from solution scattering experiments using the program DAMMIF (37). D, overlay of the rigid body model of the 14-3-3ζ·pRGS3 complex with the ab initio shape envelope. The envelope is shown in gray, the 14-3-3ζ protein is shown in light brown, and the RGS domain of RGS3 is shown in blue. The rigid body model was prepared using the crystal structure of 14-3-3ζ (21) and the RGS domain of RGS3 (27).

