FIGURE 3.
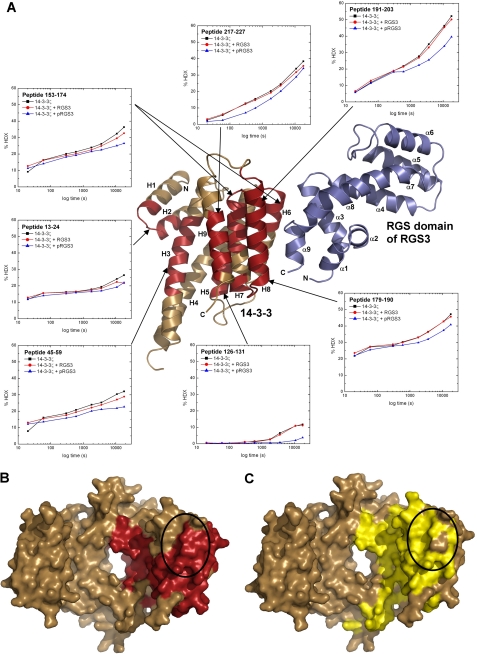
HDX-MS reveals binding interactions between 14-3-3ζ and pRGS3. A, HDX kinetics for 14-3-3ζ regions that show slower deuterium exchange kinetics upon the pRGS3 binding (shown in red) mapped on the structural model of the 14-3-3ζ·pRGS3 complex derived from SAXS. Light brown ribbons represent regions that show no significant protection against deuteration in the presence of pRGS3. Deuterium exchange is expressed as percentages relative to the maximum theoretical deuteration level for 14-3-3ζ alone (black squares), 14-3-3ζ in the presence of unphosphorylated RGS3 (red circles), and 14-3-3ζ in the presence of phosphorylated pRGS3 (blue triangles). The time units are in seconds. Only one monomer of the 14-3-3ζ dimer is shown for clarity. B, regions that show slower deuterium exchange upon the pRGS3 binding (shown in red) mapped on a surface representation of the human 14-3-3ζ isoform structure (21). C, surface representation of human 14-3-3ζ shaded according the sequence conservation. Residues that are totally conserved among all human isoforms are colored in yellow. The black ellipses in panels B and C indicate the specificity region believed to be involved in protein-protein interactions and responsible for isoform-selective contacts (44, 55, 56).

