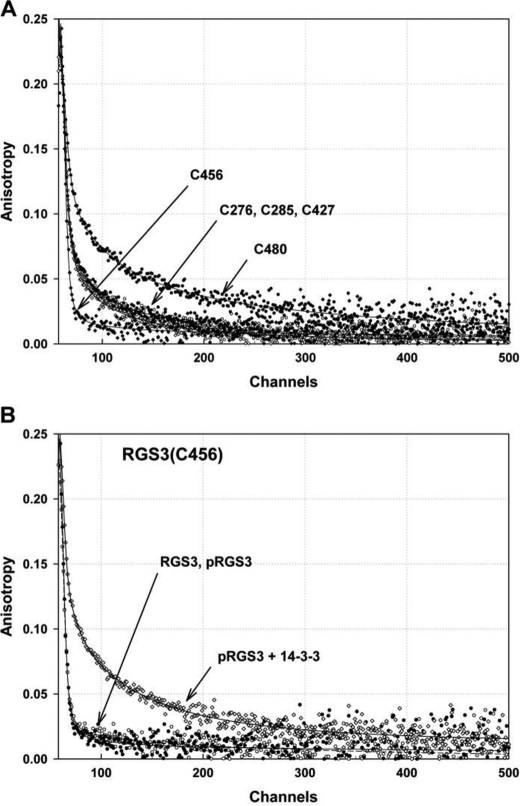
FIGURE 6.
Fluorescence anisotropy decays of AEDANS-labeled pRGS3 mutants. A, differences in the raw AEDANS fluorescence anisotropy decays of all five pRGS3 mutants. B, changes in the raw AEDANS fluorescence anisotropy decays of the pRGS3(C456) mutant resulting from the interaction with 14-3-3ζ. In both panels, the solid lines represent the best fit.

