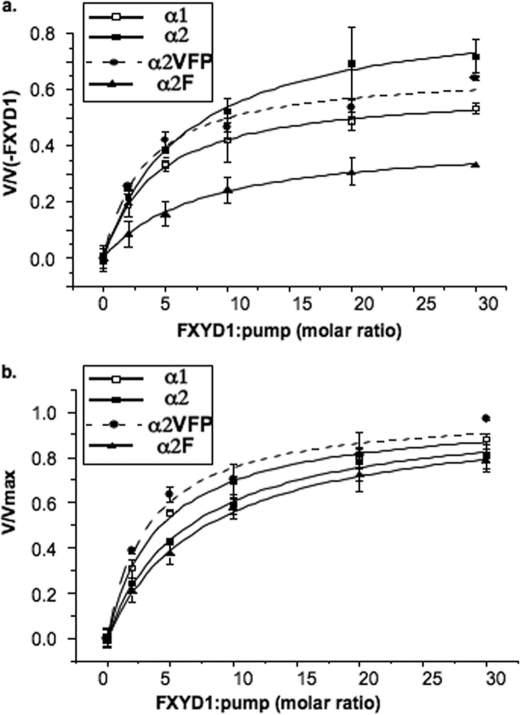
FIGURE 5.
Protection of α1β1, α2β1, α2VFPβ1, and α2Fβ1 by FXYD1 against detergent-mediated inactivation. α1β1, α2β1, α2VFPβ1, and α2Fβ1 isoform complexes were diluted to 0.11 μg/μl and incubated on ice for 4 h with FXYD1 at 0–30:1 molar ratio (FXYD1/Na,K-ATPase). C12E8 0.5 mm was added, and after incubation for 5 min at 37 °C, Na,K-ATPase was measured. Rates of ATP hydrolysis at different (FXYD1/Na,K-ATPase) ratios were fitted to the function v = ((Vmax·X)/(X + K0.5)) + V(−FXYD1). X-(FXYD1/Na,K-ATPase) and V(−FXYD1) is the rate in the absence of FXYD1. The upper plot represents v/v(−FXYD1) versus (FXYD1/Na,K-ATPase), and the lower plot normalized function represents v/Vmax versus (FXYD1/Na,K-ATPase).

