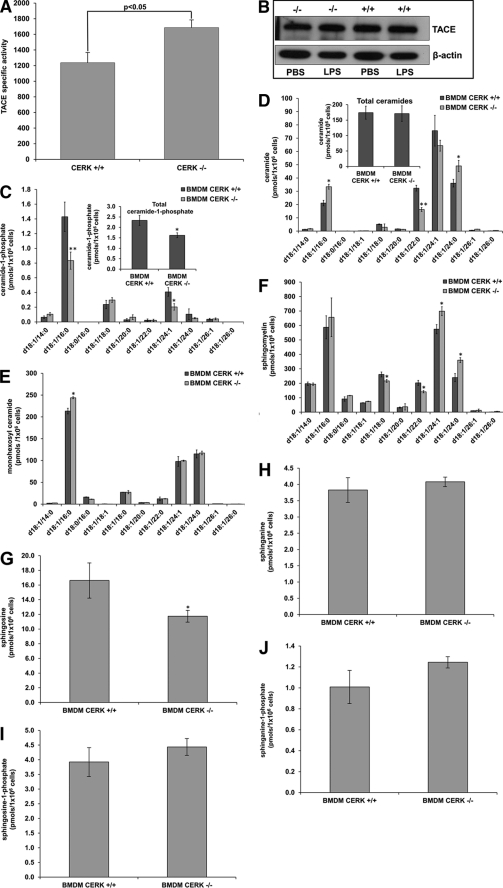
FIGURE 3.
Higher levels of TACE enzymatic activity are observed in primary macrophages isolated from CERK null mice. A, primary monocytes isolated from the bone marrow of CERK null mice and their wild-type littermates were differentiated into BMDMs and treated with LPS concentration (0.5 ng/ml) for 4 h as described under “Experimental Procedures.” Protein homogenates were harvested from these cells, and TACE specific activity (units of emission at 405 nm of cleaved fluorogenic substrate/20 min/10 μg of protein homogenate) was measured as described under “Experimental Procedures.” The data are representative of the mean ± S.E. of an n = 6 repeated on three separate occasions. B, mixture of cell extract (5 μg) combined with cell media (10 μl) (from Fig. 2B, lower panel) were subjected to SDS-PAGE and Western immunoblotting analysis for TACE and β-actins. Note: the depicted β-actin data show an exact match to the β-actin data depicted in Fig. 2B, lower panel, as the same Western immunoblot utilized in this figure was stripped and reprobed for TACE expression. C–J, primary monocytes isolated from the bone marrow of CERK null mice and their wild-type littermates were differentiated into BMDMs. Lipids were extracted from these cells 24 h later, and the lipids species of interest were quantified via HPLC ESI-MS/MS as described under “Experimental Procedures.” C, ceramide 1-phosphate levels are represented in units of picomoles per 1 × 10⁶ cells and are the means of n = 6 of individual experiments ± S.D. Student's t test was used to assess statistical significance (*, p < 0.05; **, p < 0.01). D, ceramides were also measured from the same samples and are similarly represented in units of picomoles per 1 × 10⁶ cells and are the means of n = 6 individual experiments ± S.D. Student's t test was used to assess statistical significance (*, p < 0.05; **, p < 0.01). E, monohexosyl ceramide levels represented as the mean of three experiments ± S.D. and given in units of picomoles per 1 × 10⁶ cells. Student's t test was used to assess statistical significance (*, p < 0.05). F, sphingomyelin levels represented as the mean of three experiments ± S.D. and given in units of picomoles per 1 × 10⁶ cells. Student's t test was used to assess statistical significance (*, p < 0.05). G, sphingosine levels represented as the mean of three experiments ± S.D. and given in units of picomoles per 1 × 10⁶ cells. Student's t test was used to assess statistical significance (*, p < 0.05). H, sphinganine levels represented as the mean of three experiments ± S.D. and given in units of picomoles per 1 × 10⁶ cells. Student's t test was used to assess statistical significance (NS means not significant). I, sphingosine 1-phosphate levels represented as the mean of three experiments ± S.D. and given in units of picomoles per 1 × 10⁶ cells. Student's t test was used to assess statistical significance. J, sphinganine 1-phosphate levels represented as the mean of three experiments ± S.D. and given in units of picomoles per 1 × 10⁶ cells.

