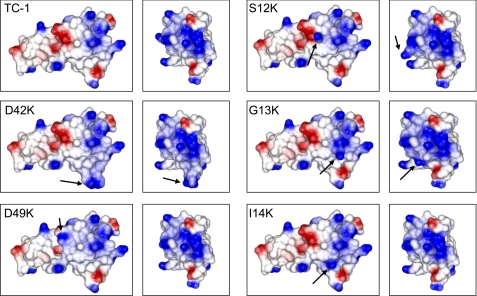
FIGURE 4.
Electrostatic surface plots of thrombocidin variants with enhanced positive patches. Electrostatic surfaces were calculated using CCP4mg, in which positively and negatively charged surfaces are shown in blue and red, respectively. The left panels correspond to the orientation of TC-1 as shown in Fig. 2A. The right panels show the molecules rotated along their vertical axis by 90°.

