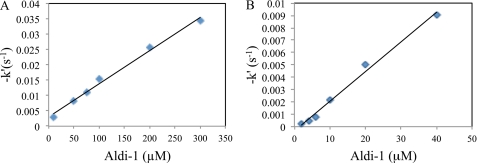
FIGURE 1.
Time-dependent inhibition of human ALDH3A1 and ALDH2. Shown is a plot of −k′ versus Aldi-1 concentration for ALDH3A1 (A) and for ALDH2 (B). The bimolecular rate constant for inhibition was determined from the slope of these lines using the method of Aldridge and Reiner (25).

